If you have data and you wish to plot the data points then this can easily be done in Scilab. Suppose we have data from an experimental result.
| x | 0.50 | 0.70 | 0.90 | 1.10 | 1.30 | 1.50 | 1.70 | 1.90 |
|---|---|---|---|---|---|---|---|---|
|
y |
0.28 |
0.40 |
0.48 |
0.60 |
0.70 |
0.76 |
0.90 |
0.98 |
To plot the data points in Scilab set up two column vectors x and y and give a plot2d command. The program is given below.
A simple program in Scilab to plot the data points
Output

This graph marks the points with an ‘+’. Other types of points can be used by changing the style=-1 in the plot2d command. You can do experiment with different values for the style. You will see that negative values give markers and positive values gives colored lines. The command, clf(); is to erase the previous plot. You can use help plot2d to find out more details.
Exercise
- Plot the above data with the points shown as stars.
- Plot the above data with the points joined by red lines.
- Plot the points as green circles.
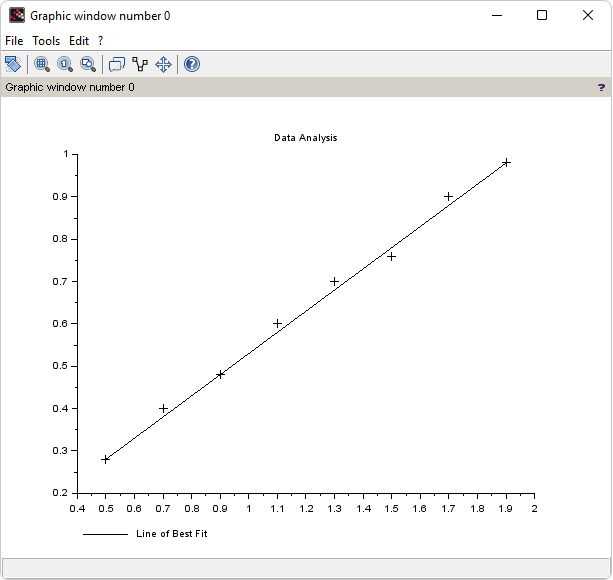
Adding a Line
In the above graph, one can see that some of the points are off the line. It is because of the experimental errors. We can fit the data to see the errors and for this we need statics. But even without statistics, the line between the points (0.50, 0.25) and (1.90, 0.98) can be used to fit this data. So, let’s add a few lines to the above program to plot the line.
Plot in Log Scale
Suppose have data of ‘n’ versus ‘Sn’ as shown in the table below.
| n | 6 | 10 | 17 | 33 | 65 | 132 |
|---|---|---|---|---|---|---|
|
Sn |
0.415 |
0.110 |
0.0183 |
0.0029 |
0.000488 |
0.000122 |
To plot the above data points in Scilab set up two column vectors x and y and give a plot2d command. The program is given below.
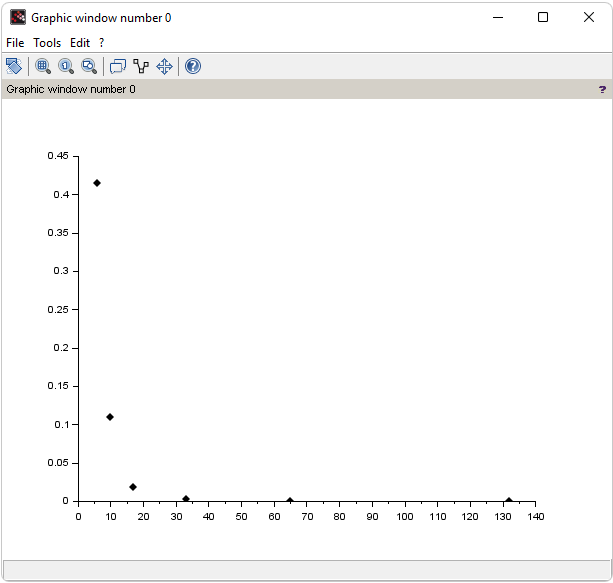
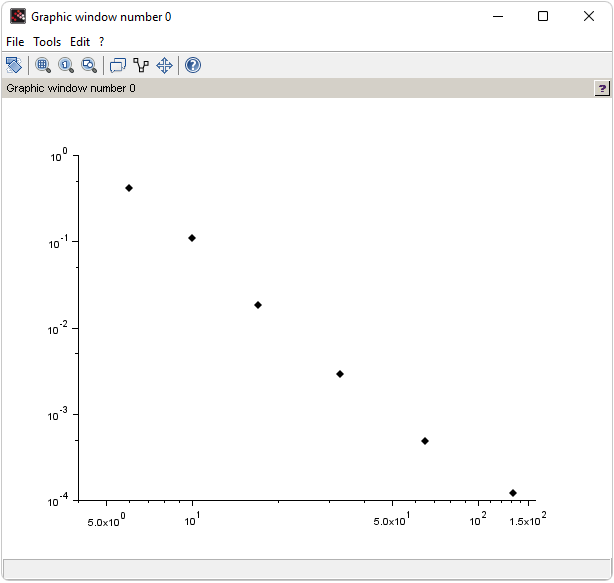
If you plot this data by using the above program you will not see any pattern. In fact, it is quite hard to read the values of Sn back from the graph. But if you plot this data in a log scale you can see a proper pattern and also it will be easy to read the values of Sn. For the log scale graph, you can use any one of the commands given below.
plot2d( log10(n), log10(s), style=-4)
plot2d( n, s, style=-4, logflag = 'll')
Program 1:
Output

Program 2:
Output