🧠 What You’ll Need
- Windows 10 or Windows 11 (64-bit)
- At least 5–10 GB of free disk space
- Administrator privileges on your PC
- Stable internet connection
🧩 Step 1 — Install Microsoft Visual Studio Build Tools
ROOT on Windows requires Microsoft’s C++ toolchain (MSVC).- Go to Visual Studio Downloads.
- Find Tools for Visual Studio → Build Tools for Visual Studio 2022.
- Run the installer and choose Desktop development with C++.
- Ensure MSVC, Windows SDK, and CMake tools are selected, then install.
🐍 Step 2 — Install Python 3.11 (64-bit)
- Download from python.org.
- Run the installer and check Add Python 3.11 to PATH.
- Verify installation:
py -3.11📦 Step 3 — Download CERN ROOT for Windows
- Go to root.cern/install.
- Download the version matching Python 3.11 (example):
root_v6.36.04.win64.python311.vc17.zip
🗂️ Step 4 — Extract ROOT to C:\root
- Create a folder
C:\root. - Extract the downloaded ZIP to
C:\root. - The final path should look like
C:\root\root\bin.
⚙️ Step 5 — Configure the ROOT Environment
Before running ROOT, you must load its environment variables:cd C:\root\root\bin
thisroot.bat🧪 Step 6 — Test ROOT with Python (PyROOT)
After runningthisroot.bat, start Python:
py -3.11import ROOT
print(ROOT.__version__)6.36.04, the setup is correct.
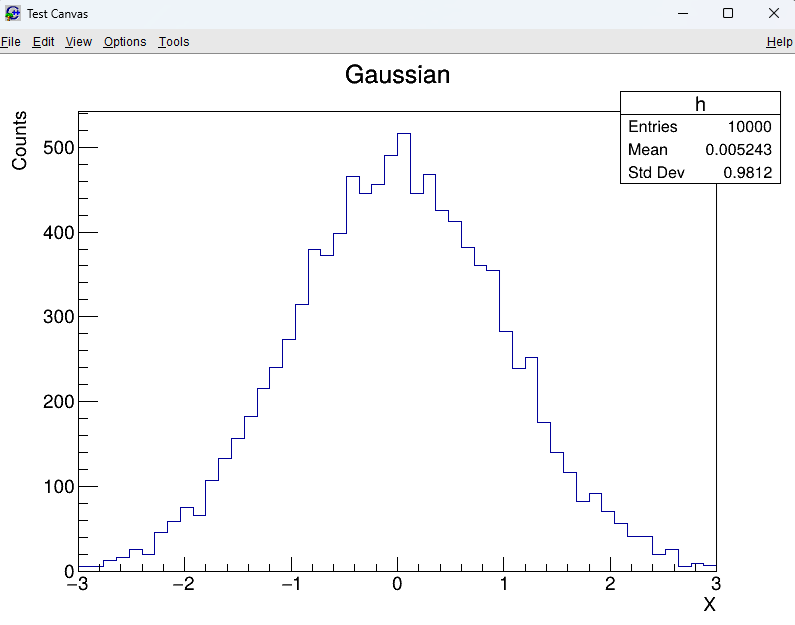
📊 Step 7 — Create and Save Your First Histogram
Now try a small PyROOT script:import ROOT
print(ROOT.__version__)
h = ROOT.TH1F("h", "Gaussian; X; Counts", 50, -3, 3)
for _ in range(10000):
h.Fill(ROOT.gRandom.Gaus())
c = ROOT.TCanvas("c", "Test Canvas", 800, 600)
h.Draw()
c.SaveAs("test_hist.png")test_hist.png in your working directory. The histogram shown in the picture below is what you will see.
🚀 Step 8 — (Optional) Create a ROOT Shell Shortcut
- Right-click your Desktop → New → Shortcut
- Paste this command:
C:\Windows\System32\cmd.exe /k "C:\root\root\bin\thisroot.bat"Name it ROOT Shell. Double-click it to open a command prompt with ROOT preloaded.
🧭 Troubleshooting
- ImportError: DLL load failed while importing libcppyy — Python version mismatch. Install the exact version listed in the ROOT filename (e.g., python311 → Python 3.11).
- If
import ROOTfails, make sure you ranthisroot.batfirst. - If plots don’t display, ensure you are running in an environment that supports GUI (not a headless terminal).
📚 Next Steps
- Understanding
TCanvasandTH1objects - Fitting functions (Gaussian, Exponential)
- Working with
TFileandTTree - Using
RDataFramefor analysis
References & Further Reading
- CERN ROOT — Official Website: https://root.cern/
- Brun, R. & Rademakers, F. (1997). “ROOT – An Object Oriented Data Analysis Framework.” Nuclear Instruments and Methods in Physics Research A, 389(1–2), 81–86. DOI: 10.1016/S0168-9002(97)00048-X
- CERN Documentation: ROOT User Manual and Tutorials
- TMVA Toolkit for Multivariate Data Analysis: https://root.cern/manual/tmva/
- GEANT4 Collaboration. “GEANT4 – A Simulation Toolkit.” Nuclear Instruments and Methods in Physics Research A, 506(3), 250–303 (2003). DOI: 10.1016/S0168-9002(03)01368-8
- FLUKA Simulation Package — Official CERN Page: https://fluka.cern/
- CERN Open Data Portal — Public Datasets for Education and Research: https://opendata.cern.ch/
- CERN Scientific Computing Documentation: https://home.cern/science/computing
- C++ ROOT Tutorials for Beginners (Official GitHub Examples): https://github.com/root-project/root/tree/master/tutorials