Theory:
Before writing the program let’s have a look at the formation of Beats.
When two waves having equal amplitude but slightly different frequencies, are traveling in the same direction and arrive at a particular point simultaneously, then alternate maxima and minima are formed. This phenomenon is called the formation of beats.
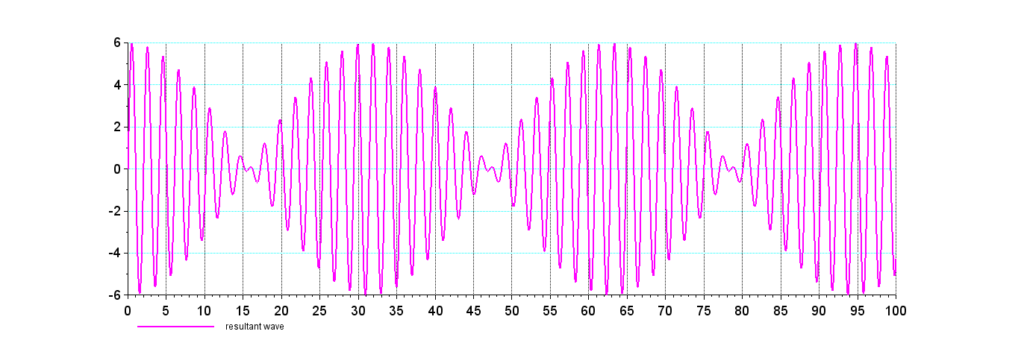
Let’s have two waves of the same amplitude and slightly different frequencies. Let the first wave is y1=3\sin(3t) and the second wave is y2=3\sin(3.2t). When these two waves arrive at a particular time simultaneously, a beautiful formation of beats is observed. Now, if you add these two waves, you can see the formation of beats.
A Program in Scilab for the Beat Formation
Open the Editor and type your program. Let’s write the program for t = 0 to t = 100\rm \ s. The program looks as
Decoding:
- In line no. 1, command clf(); is used to erase the previous plot in the graphic window.
- Line no. 2 is written for the loop over t from t = 0 to t = 100\rm \ sec with step size 0.01.
- Line no. 3 is written for the frequency of the first wave.
- Line no. 4 is written for the frequency of the second wave.
- Line no. 5 is written for the equation of the first wave.
- Line no. 6 is written for the equation of the second wave.
- Line no. 7 is written for the resultant of two waves. That is beat.
- Line no. 8 is written to plot beat formation. Here, leg is the command used for legend to which it will appear in the graphics window.
Now execute the program by pressing the key “F5”, assign its name, and press the “Enter” key. You can see a graph showing beat formation as shown below.
Output