Introduction
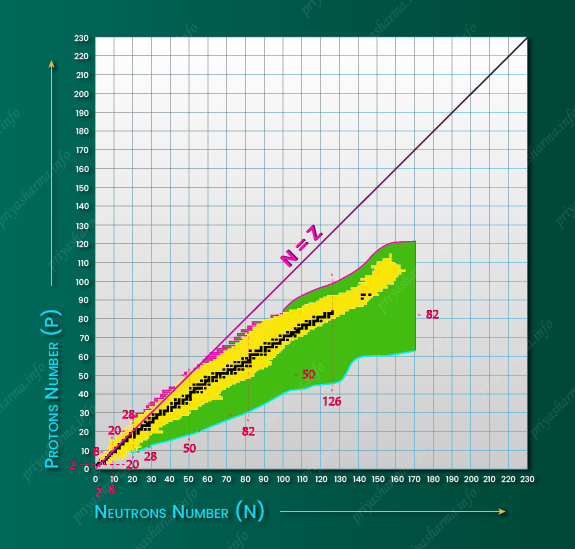
From the discovery of the nucleus until now, it has been passed almost a century of the journey of nuclear physics. But in this long duration, most of us have been exploring the ways to use it rather than exploring the world of nuclei. That’s why only a few nuclei have been discovered to date. We have discovered that there are 288 stable or nearly stable nuclei that occur in nature, which is around 99.9 \% of the matter in the visible world around us. Apart from that more than 3,000 nuclei have been synthesized in laboratories. But this number is less than half of the number of nuclei that could exist in our world. Actually, more than 6000 nuclei might exist in this world. Scientists typically map these nuclear species onto a chart of nuclei called ‘nuclear landscape’. The nuclear landscape is basically the periodic table of nuclear physics just like the periodic table in Atomic physics.
It is the arrangement of all possible nuclei according to its unique combination of neutrons and protons.

Beta Stability Line
In the above diagram, you can see the nuclear landscape that defines the territory for nuclear physics research. In the diagram, black squares represent stable nuclei that define the valley of stability. It is also called the ‘beta stability line’ because the unstable nuclei in the neighborhood of the stable nuclei decay preferentially by beta particle emission and attain the stable configuration. The yellow region represents the range of observed unstable nuclei that have been explored by adding or removing neutrons or protons in reactions with stable nuclei. In these nuclei, the neutron to proton ratio is more or less than what is required for stability. They decay to other nuclei via alpha-decay for heavy nuclei and beta-decay for intermediate and lighter nuclei until they attain some stable nuclei. The green region represents many thousands of radioactive bound nuclei far from the valley of stability that remains to be explored. The line of stability almost coincides with the N = Z line for the lightest nuclei but tends toward more neutron-rich isotopes for heavier nuclei.
The Neutron Drip Line
The number of isotopes of any known nucleus depends on the interplay between the electromagnetic force between protons and the strong nuclear forces between nucleons inside the nucleus. So, there is a limit up to which the neutrons can be added to or removed from a given nucleus. And hence the drip line to the bottom right of the chart of nuclei is called the neutron drip line. The neutron drip line is reached when the binding energy for the last neutron becomes zero.
The Proton Drip Line
Just like the limitation of isotopes, there is a limitation in isobar also. The number of isobars for a given mass number is limited; i.e. there is a limit up to which the protons can be added to a given nucleus. And hence the drip line to the upper left of the chart of nuclei is called the proton drip line. The proton drip line is reached when the binding energy for the last proton becomes zero.
Drip Line Nuclei
The nucleus after which no more proton or neutron can be added to a given nucleus is called the drip-line nucleus. That is the nuclei that lie on the drip lines are called the drip-line nuclei.
Till now proton and neutron drip lines have not been well known for the heavier elements. So, there is a lot of research is needed in the heavy and super-heavy region of nuclear physics to develop the nuclear landscape.
Magic Numbers
The vertical and horizontal dashed lines represent magic numbers 2, 8, 20, 28, 50, 82, and 126, which occur when major nuclear shells are filled. Doubly magic nuclei lie at the intersections of dashed lines. It occurs when both the proton and neutron numbers are the magic number. Symmetrical nuclei in the nuclear chart have an equal number of protons and neutrons and hence they lie on the N = Z line.
